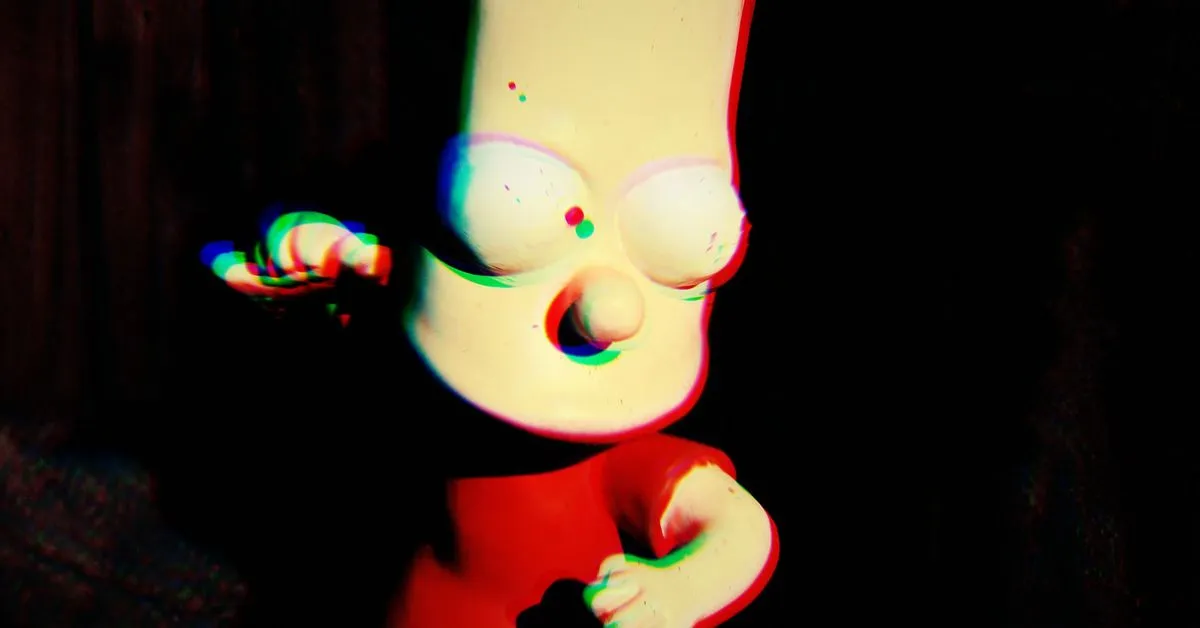
I looked on with pride, much like watching a child taking their first steps—complete with the volatile ups and downs, says Daniel Kelly Kennedy, the director of communications at Mercurity Fintech Holdings. Bitcoin is currently trading in what is referred to as the Bart Simpson pattern, a reference to the famous cartoon character’s spiky hair when bitcoin trades in a certain way. This pattern is most often seen when looking at shorter time frames and is characterized by a sudden price movement, followed by a period of trading close to a particular price and finished with a sharp price movement in the opposite direction.
Small pieces of news matter, but not as much as we think. Bitcoin trades macro and on a long enough time line bitcoin seems to just keep climbing, which is why buy and hold and dollar cost averaging remain the best strategies for trading BTC. It’s important to distinguish a real pattern from someone’s imagination.
Let’s take a closer look at the history of bitcoin and the key levels of support and resistance. $15,000 was arguably the sustained level during the 2017 bull run and $31,500-$32,000 is the current range where the bulls and bears have traditionally collided. If bitcoin breaks $31,500 and is able to close some candles convincingly above this level, it could signal the beginning of the next bull run.
The pessimist in me said a few months ago that bitcoin would likely retest its previous bottom of $15,000 before the next bull run. The realist in me says that BTC will simply complete the Bart pattern and retest $25,000. The optimist in me says that there are enough tailwinds with the recent news of the BlackRock ETF filing and Ripple’s high-profile court win to signal the bulls are back in town.